Business Analytics and AI Course in India: SQL, Python, Power BI, and Generative AI Explained

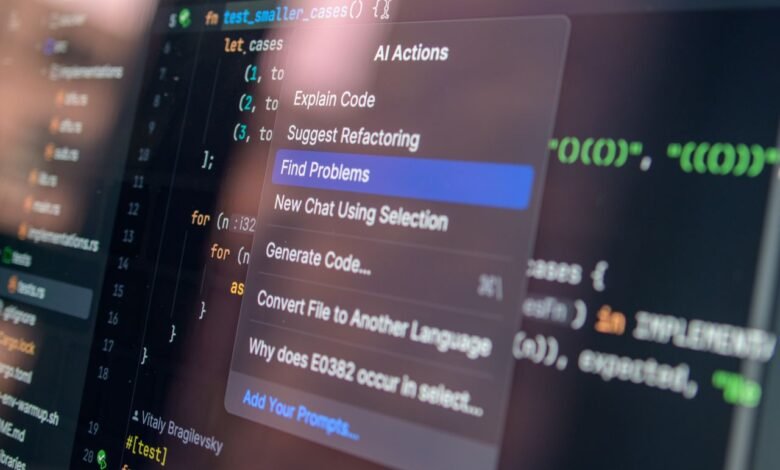
An advanced business analytics and AI course in India should teach learners how to collect, query, analyse, visualize, and communicate data and use AI to turn that analysis into faster, more reliable business decisions. The most useful programmes combine SQL, Python, Power BI, predictive modelling, Generative AI, prompt engineering, and intelligent automation so learners can move beyond reports and deliver decisions that improve revenue, operations, customer experience, and profitability.
This is where Boston Institute of Analytics comes into the picture. The Business Analytics & Artificial Intelligence program by Boston Institute of Analytics covers topics such as data analytics, visualization, predictive modeling, generative AI, prompt engineering, and intelligent automation, and the course pathways cater to both beginners and experienced professionals alike.
SQL Explained: The Foundation of Business Analytics
Why SQL Matters for Business Analysts?
SQL stands for Structured Query Language and is the language that extracts, filters, joins, and summarizes data in business databases. It helps answer queries like “What products made money last quarter?” or “What customer segments are likely to experience churn?”
For instance, a person working with data can join several tables, filter for a certain time period, calculate revenue and its growth rate, and prepare a ready-to-use data set for charts.
The importance of SQL lies in the fact that business data is mostly stored in structured form: sales database, CRM system, ERP, finance system, or data warehouse. In case the company uses advanced AI solutions, somebody has to know where the data is coming from, whether it is complete and whether business logic behind the metric is correct.
SQL Skills to Look for in a Course
A good SQL Python Power BI Generative AI course should include:
- Database fundamentals: tables, rows, columns, data types, and relationships.
- SELECT, WHERE, ORDER BY, and LIMIT queries.
- Filtering, sorting, grouping, and aggregation using functions such as SUM, COUNT, AVG, MIN, and MAX.
- JOINs across multiple business tables.
- Subqueries, case statements, date functions, and data-quality reviews.
- Window functions and advanced querying for rankings, running totals, and period comparisons.
- Data extraction for dashboards, reports, and machine-learning datasets.
Python Explained: From Data Analysis to Predictive Insights
Why Python Matters in Analytics?
In this regard, Python makes it possible to clean big data, do some automation work, carry out statistical analysis and develop predictive models. Python is particularly helpful when there are cases of complex analysis that can neither be done by Excel nor SQL, such as customer segmentation, churn prediction, demand forecasting or advanced data transformation.
Also, Python is helpful because it integrates all the different aspects of the analytics process. A person using Python is capable of cleaning data, developing features, carrying out statistical analysis, visualization of the analysis and preparation of the data for the dashboard or machine learning algorithms.
Python is also used inside Power BI’s Power Query Editor for data cleansing and advanced data transformation.
Python Concepts a Good Course Should Cover
A strong AI business analyst course in India should cover:
- Python basics: variables, functions, loops, and data structures.
- Pandas for data cleaning, filtering, merging, grouping, and transformation.
- NumPy for numerical analysis and array-based operations.
- Matplotlib or Seaborn for visualization and exploratory data analysis.
- Statistics and probability for business decisions.
- Correlation, regression, classification, clustering, and forecasting fundamentals.
- Machine-learning fundamentals for prediction and classification.
- Automation of recurring reporting tasks.
Power BI Explained: Turning Data into Business Decisions
Why Power BI Is Essential?
Through Power BI, analysis results in dashboards that managers can interpret easily. A good dashboard will answer business questions rather than present only graphs.
For instance, sales dashboards should not only present revenues generated from sales. They must indicate how the organization is performing compared to its targets, the areas and/or products responsible for that performance, accountabilities that require urgent action, and possible actions management should consider.
Power BI is widely used since it has data modeling, interactive reporting, and self-service business intelligence capabilities. It allows analysts to access data sources, transform the data, create relationships among tables, make measures, and publish interactive reports.
Power BI Skills to Learn
A quality Power BI and Generative AI course should include:
- Power BI fundamentals and interface.
- Data connection and data transformation using Power Query.
- Data modelling and relationships.
- DAX calculations and measures.
- Interactive dashboards, slicers, filters, and drill-downs.
- KPI tracking and performance reporting.
- Data storytelling for stakeholders.
- Dashboard design principles: clarity, context, comparison, and actionability.
Generative AI Explained: The New Analytics Advantage
What Generative AI Does for Business Analysts?
AI generative applications may speed up the research process, data analysis, drafting of reports, summarizing insights, and narrative building on dashboards. It is important to remember, however, that analysts should verify the output provided by AI with the source data.
AI generative applications become highly useful when they shorten the period from analysis to communication. Analysts do not have to spend hours preparing the first draft of a monthly business review but use AI to structure insights, to analyse variances, to suggest hypotheses and even to build narratives.
It is still the analysts who need to check the numbers, definitions, assumptions, and recommendations.
Generative AI Skills to Look for
Look for a programme that teaches:
- Generative AI fundamentals and large language models.
- Prompt engineering for business analysis.
- Zero-shot and few-shot prompting.
- Output validation and quality control.
- AI-assisted data analysis.
- AI-powered reporting and insight generation.
- Building AI assistants and intelligent workflows.
- Responsible use of AI, including data privacy, bias awareness, and human review.
How SQL, Python, Power BI, and GenAI Work Together?
The strongest analytics specialists do not treat SQL, Python, Power BI, and Generative AI as separate skills. They use them as parts of one workflow.
| Stage | Tool | Business outcome |
|---|---|---|
| Extract data | SQL | Pull clean, relevant data from business systems |
| Analyse and model | Python | Clean data, find patterns, and build forecasts |
| Visualize insights | Power BI | Create dashboards for decision-makers |
| Explain and accelerate | Generative AI | Summarize findings and draft recommendations |
| Automate workflows | AI agents / no-code automation | Reduce repetitive reporting work |
Consider a retail business trying to improve monthly sales performance:
- SQL extracts sales, inventory, customer, and store data.
- Python cleans missing values, calculates growth metrics, identifies outliers, and builds a demand forecast.
- Power BI presents revenue, margin, stock availability, and regional performance in an interactive dashboard.
- Generative AI summarizes the findings and drafts a leadership update.
- Automation schedules data refreshes, alerts stakeholders to anomalies, and reduces manual reporting effort.
This combined approach is what makes an AI-enabled business analyst appreciated: The role is not only about producing charts, but about converting data into decisions and repeatable business processes.

What Makes Boston Institute of Analytics Different?
Boston Institute of Analytics markets the Business Analytics & AI program as a career-focused learning opportunity instead of just theoretical studies. The goal of this program is to provide learners with skills related to Generative AI, Agentic AI, data analytics, intelligent automation, and AI-driven data visualization.
Practical, Application-First Learning
At Boston Institute of Analytics, students receive practical experience working with actual business data and modern AI technology. The analytics process consists of defining a business problem, preparing data, conducting analyses, modeling, visualizing, and presenting results.
It is important because employers usually require more than just proficiency with tools from their candidates. They need people who are able to understand the business problem, deal with imperfect data, make assumptions, create an output, and communicate their findings.
AI-First Curriculum
The course will deal with Generative AI, Agentic AI, data analytics, intelligent automation, and visualization of information through AI. Such an assortment becomes important considering that organizations not only want their analysts to prepare reports, but want them to use the power of AI for faster insights and automation of certain steps in the report preparation process.
Business-Domain Exposure
A quality education in analytics must ensure a connection between technical skills and business applications. The Boston Institute of Analytics covers various aspects of business including marketing, finance, operational management, and strategic decisions in order to enable students to understand analytics in relation to other disciplines.
Flexible Learning Modes
The Boston Institute of Analytics provides flexibility in terms of learning styles and practical classes led by instructors that allow learners to gain experience through practice. Such an approach may prove useful for beginners, working professionals, and career changers.

Boston Institute of Analytics Program Formats
Boston Institute of Analytics offers three education paths for its Business Analytics and AI programme:
| Programme | Duration | Practical exposure |
|---|---|---|
| Business Analytics & AI Certification | 4 months | Foundational and applied analytics learning |
| Business Analytics & AI Diploma | 6 months | Includes a guaranteed 2-month internship |
| Business Analytics & AI Master Diploma | 10 months | Includes guaranteed 6 months of on-job training as a Business Analyst |
Career Roles After the Course
A business analytics and AI course can prepare learners for several data-focused roles. The exact responsibilities vary by company and industry, but the core skill set remains reliable: SQL, Python, visualization, business communication, and AI-enabled analysis.
| Role | Core tools | Typical work |
|---|---|---|
| Business Analyst | SQL, Excel, Power BI | KPI analysis, reporting, stakeholder communication |
| Data Analyst | SQL, Python, Power BI | Data cleaning, dashboards, trend analysis |
| Marketing Analyst | SQL, Power BI, GenAI | Campaign performance, customer segmentation |
| Financial Analyst | Excel, Power BI, Python | Forecasting, variance analysis, financial reporting |
| Operations Analyst | SQL, Python, dashboards | Process optimization and performance tracking |
| AI-Enabled Business Analyst | GenAI, prompt engineering, automation | AI-assisted insights and workflow automation |
Business Analyst
The business analyst concentrates on problem identification in the company, requirements specification, analysis of the performance and communication of findings. SQL and Power BI are critical due to the need to work with stakeholders, define key performance indicators and translate data into actions.
Data Analyst
Data analyst works with datasets and dashboards much more frequently than other professionals. Therefore, programming languages like Python become particularly useful for automations, statistics and predictions.
Marketing Analyst
The marketing analyst evaluates campaigns’ performance, measures customer acquisition and retention, conversion rate, as well as behaviour of segments. Generative AI may be helpful in summarizing performance and generating new hypotheses for testing.
Financial Analyst
Analytical activities of financial analysts include budgeting, forecasting, variance analysis, profitability analysis, and management reports. Both Power BI and Python can aid in performing more efficient and scalable financial analysis compared to manual methods in spreadsheets.
Operations Analyst
Operations analysts optimize processes, measure efficiency and find bottlenecks. SQL and Python assist in analysing operations data, whereas dashboards show the performance metrics to the management.
AI-Enabled Business Analyst
The new role includes a combination of the usual business analyst activities with Generative AI, prompt engineering and intelligent automation. The emphasis is on the application of AI to speed up the insight generation process.

Frequently Asked Questions:
- What is a Business Analytics and AI course in India?
A Business Analytics and AI course in India teaches learners to collect, query, analyze, visualize, and communicate business data using SQL, Python, Power BI, and Excel. It also includes Generative AI, prompt engineering, predictive modelling, and intelligent automation to support faster, data-driven business decisions.
- Which tools are taught in Boston Institute of Analytics’ Business Analytics and AI course?
Boston Institute of Analytics’ programme covers SQL, Python, Power BI, Excel, Generative AI, prompt engineering, AI agents, no-code automation, predictive analytics, and AI-powered data visualization. Learners also work with real business scenarios, dashboards, case studies, and practical projects to build job-ready analytics and AI skills.
- Is a Business Analytics and AI course suitable for freshers?
Yes. The course is suitable for fresh graduates who want to enter business analytics, data analysis, business intelligence, marketing analytics, or AI-enabled business roles. Boston Institute of Analytics begins with foundational business and analytical concepts before progressing to Python, predictive modelling, Generative AI, and intelligent automation.
- Can non-technical students learn business analytics and AI?
Yes. Non-technical students can learn business analytics and AI through a structured, practical curriculum. Boston Institute of Analytics accepts learners from commerce, management, finance, marketing, engineering, and non-technical backgrounds, and no prior programming or AI experience is required to enrol.
- Why is SQL important for business analysts?
SQL is important because it helps business analysts extract, filter, join, and summarize data from business databases. Analysts use SQL to answer questions about sales performance, customer segments, churn risk, regional growth, product performance, and operational efficiency before presenting insights through Power BI dashboards.
- How do SQL, Python, Power BI, and Generative AI work together?
SQL extracts clean and relevant business data, Python cleans data and builds predictive models, Power BI turns insights into interactive dashboards, and Generative AI summarizes findings and drafts recommendations. Together, they create an end-to-end workflow for data-driven business decision-making and automation.
- What are the programme durations at Boston Institute of Analytics?
Boston Institute of Analytics offers three learning paths: a 4-month Business Analytics and AI Certification, a 6-month Diploma with a guaranteed 2-month internship, and a 10-month Master Diploma with guaranteed 6 months of on-job training as a Business Analyst.
- What career roles can I pursue after the course?
After completing the programme, learners can pursue roles such as Business Analyst, Data Analyst, Business Intelligence Analyst, Marketing Analyst, Financial Analyst, Operations Analyst, AI Business Analyst, Data Visualization Specialist, Prompt Engineer, and Business Process Automation Analyst across technology, banking, retail, healthcare, consulting, and e-commerce.
Final Thoughts
It’s clear that the future of business analytics lies in hands of people who have both the ability and business acumen to use data. SQL allows you to connect and process data. Python allows you to analyse data and build models and automation. Power BI allows you to present insights using dashboards. Generative AI allows you to accelerate your research and reporting work.
Boston Institute of Analytics’ business analytics and AI certification follows an integrated approach based on Data analytics, Visualisation, Predictive Modelling, Generative AI, Prompt Engineering and Intelligent Automation. The various program options available from four-month certification program to ten-month Master Diploma program with On Job Training Program are available for learners.
Discover the Business Analytics & AI program of Boston Institute of Analytics.
READ ALSO: 7 Ways an AI Agent for HVAC Is Cutting Service Costs for US Contractors in 2025